Samsung Owns 64% of What Google's AI Says About Phones in Indonesia.
// table_of_contents▸
We put 266 real buying questions to Google AI Mode in Indonesia and counted every brand it named. Samsung took almost two thirds of the mentions and Apple barely a sixth. Here is how Google's AI already picked a winner, and what the rest of the market can do about it.
We ran this study ourselves. We put 266 real buying questions about phones to Google AI Mode in Indonesia, captured every answer it generated, and tagged every brand it named. The headline is blunt. Samsung already owns Google's AI answer for this category, pulling close to 64 percent of all brand mentions while Apple, the nearest rival, managed about 16.
That matters because search is no longer a list of blue links. When a shopper in Jakarta asks which phone has the best screen, or which brand has the widest service network, Google AI Mode writes back a paragraph that names brands, praises some, hedges on others, and quietly drops the rest. Most marketers have no idea where they land inside that paragraph. You can rank first for a keyword and still be absent from the only sentence the buyer actually reads.
So we measured it. Here is what the data shows, and the playbook we now run to move those numbers.
| What we measured | Figure |
|---|---|
| Product claims analysed | 266 |
| Category themes | 7 |
| Leading brands tracked | 5 |
| Brand mentions logged | 1,706 |
| Leader share of voice | about 64% |
| Claims that name the leader | 91% |
| Leader visibility from its top 10 claims | 16% |
| Claims where rivals appear and the leader does not | 24 |
| Claims the leader owns outright | 66 |
How we ran the study
Every step here was done by hand, in house. We took the Indonesian smartphone category and built a question set around the non-branded queries real buyers type, the ones that start with "best," "which," "is it worth," and "how do I choose." For each query we captured the answer Google AI Mode generated, then broke that answer into individual product claims. A claim might be something like premium AMOLED display quality, seven years of software updates, or the widest service-center coverage.
That gave us 266 distinct claims, grouped into 7 themes that span the whole category, from cameras and battery to after-sales value, software, design, and performance. For every claim we logged which of the five leading brands, Samsung, Apple, Oppo, Vivo, and Huawei, the AI named, how many times, and whether the mention read as positive, neutral, or negative.
Across those 266 claims, Google's AI named the five brands 1,706 times. That pool of mentions is the real estate everyone is competing for now, and it behaves very differently from a page of search results.
Finding one, Samsung compounds its lead
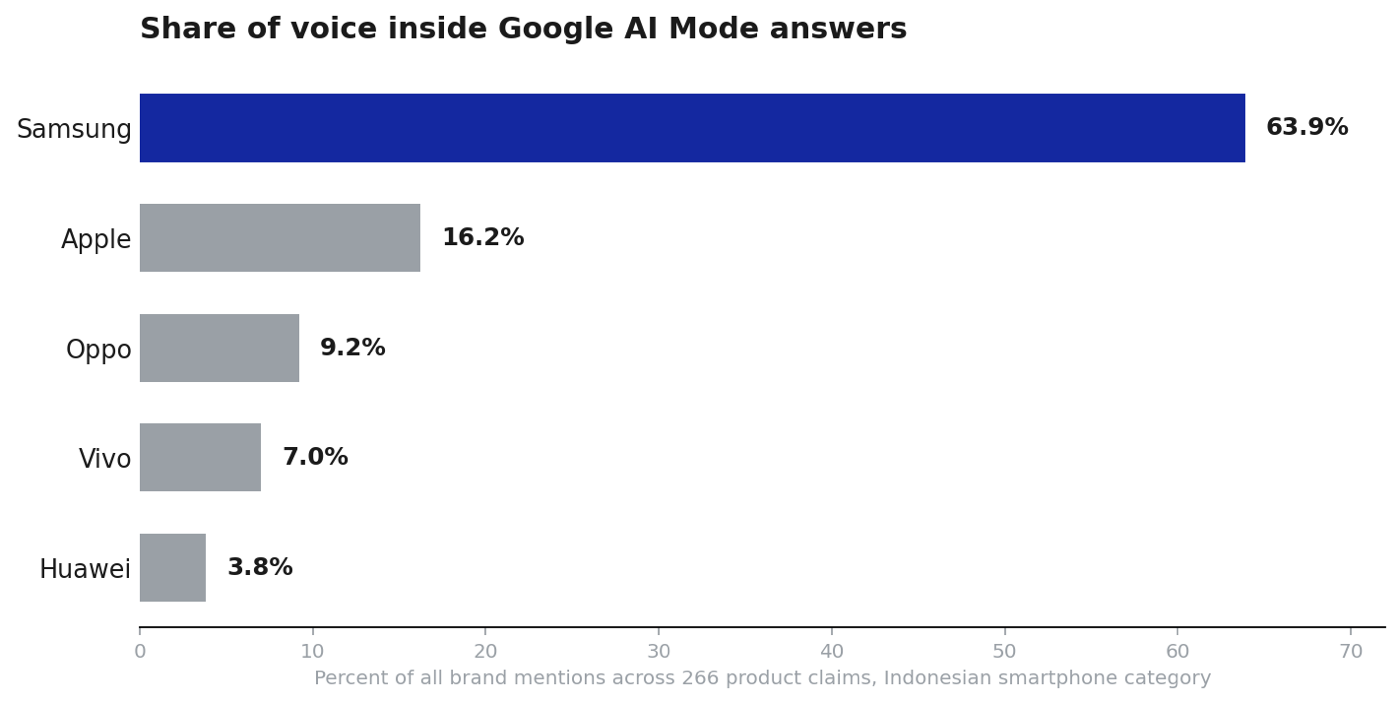
Samsung, the brand that already leads the category offline, also dominates the AI answer. It captured close to 64 percent of all brand mentions and showed up in 91 percent of the 266 claims. Apple, the nearest challenger, reached about 16 percent and appeared in roughly half of the claims. Oppo, Vivo, and Huawei split single-digit shares between them.
This is the part that should worry challenger brands and reassure leaders. Generative search amplifies whoever the web already associates most strongly with a category. The model is summarising the consensus of everything it has read, and consensus favours the brand with the most reviews, the most coverage, the most structured information, and the longest history of being described a certain way. Position compounds. The rich get cited.
The flip side is that share of voice in AI answers is now a measurable asset, the same way domain authority became one fifteen years ago. You can track it, benchmark it against rivals, and move it.
AI Mode Share of Voice
| Brand | Mentions | Share of voice | Claims present | Positive sentiment |
|---|---|---|---|---|
| Samsung | 1,090 | 63.9% | 91% | 88% |
| Apple | 276 | 16.2% | 49% | 88% |
| Oppo | 157 | 9.2% | 35% | 90% |
| Vivo | 119 | 7.0% | 29% | 85% |
| Huawei | 64 | 3.8% | 19% | 86% |
Finding two, visibility is a long tail, not a hero term
Here is the result that changes how you should brief content. We expected a handful of marquee claims to carry the leader's visibility. They do not. The top 10 claims account for only 16 percent of the leader's mentions. The other 84 percent comes from a long tail of small, specific statements spread across hundreds of attributes.
The AI did not name the leader because it owns one famous keyword. It named the leader because the web describes that brand across a vast surface of attributes, after-sales coverage, display tech, software longevity, accessibility features, smart-home compatibility, repair turnaround, and dozens more. Each attribute is a small door into the answer. Win enough of them and you become unavoidable.
For anyone still planning content around ten high-volume keywords, this is the wake-up. Generative engines reward breadth of verifiable attribute coverage, not a thin cluster of hero pages.
Finding three, sentiment travels with the mention
Being named is necessary but not sufficient. We scored the tone of every mention, and the differences are real. Across the category the AI describes brands positively most of the time, with Samsung sitting near 88 percent positive. But certain claims drag the average down hard, and they are predictable. Anything touching resale value, warranty fine print, repair cost, or build durability on specific models is where neutral and negative language clusters, for every brand.
That matters because a buyer reading an AI answer absorbs the framing, not just the brand name. A mention wrapped in a hedge is worth a fraction of a clean one. Sentiment is now a content target, not a PR afterthought.
Finding four, the gaps are a map
Two numbers from the study point straight at where to spend effort.
There are 24 claims where the leader is absent while at least one rival is named. That is exposed ground, places where the competition is shaping the answer and the leader is silent. For a challenger brand, those same 24 claims are the cheapest way in, because the leader is not defending them.
There are also 66 claims where the leader is the only brand the AI names at all. That is uncontested territory, attributes the brand effectively owns inside the answer. Those need defending, not growing, and they tell you which strengths are already locked in so you stop over-investing there.
Put together, the absence map is more useful than the presence map. It tells you exactly which sentences to go and earn.
Finding five, strength is uneven across themes
Share of voice averages hide where a brand is actually exposed, so we cut the 266 claims into their 7 themes and measured Samsung's share inside each one.
AI Mode Leader Share by Theme
| Theme | Claims | Total mentions | Samsung share |
|---|---|---|---|
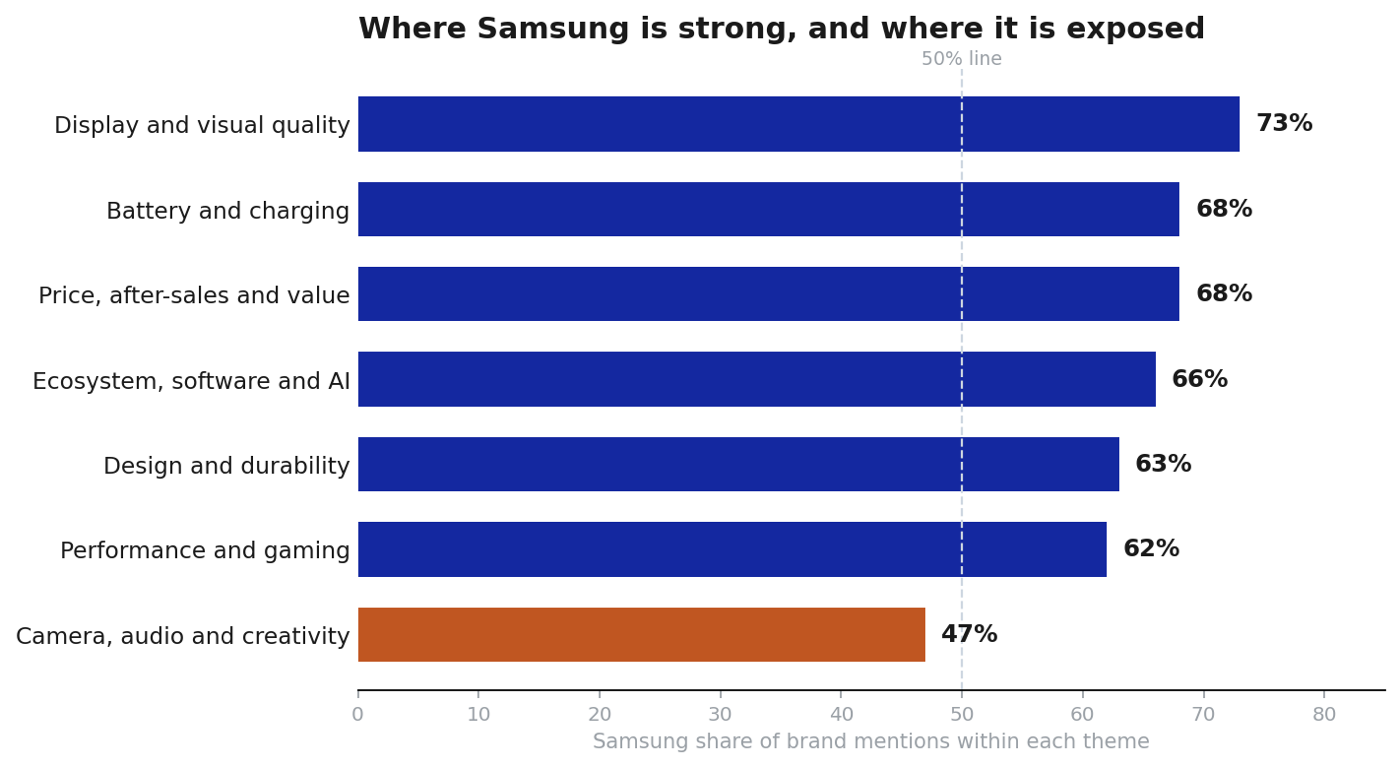
| Display and visual quality | 35 | 184 | 73% |
| Battery and charging | 22 | 95 | 68% |
| Price, after-sales, value and security | 49 | 382 | 68% |
| Ecosystem, software, AI and productivity | 52 | 454 | 66% |
| Design, materials and durability | 36 | 214 | 63% |
| Performance, processor and gaming | 31 | 158 | 62% |
| Camera, audio and creativity | 41 | 219 | 47% |
The pattern is sharp. Samsung is strongest on display and visual quality, holding roughly 73 percent of mentions there, and almost as dominant on battery and charging, on after-sales value and security, and on the software and ecosystem theme that carried the most mentions overall at 454. Design and performance sit a little lower, in the low sixties.
Then there is camera, audio, and creativity. It is the only theme where Samsung holds under half of all mentions, at about 47 percent, and it is one of the most contested areas in the whole category by volume. Apple, Oppo, and Vivo together take more than half of the camera mentions, the photography-focused challengers concentrating exactly where the AI is most willing to name someone other than Samsung. For Samsung that is the single clearest vulnerability in the data. For a challenger it is the obvious beachhead, the theme where the door is already open.
The lesson generalises. Do not manage AI visibility as one blended number. Manage it theme by theme, defend the themes you dominate, and pick the contested theme where your real product strength gives you a right to win.
The playbook
The findings convert into a repeatable way of working. We now run this for clients in electronics, and we have replicated the same method in a second sector, hospitality and serviced apartments, where the structure of AI answers looked remarkably similar. The plays below hold across both.
Inventory the claim space before you write a word. Pull the non-branded questions for your category, capture the AI answers, and decompose them into individual claims the way we did here. You cannot optimise for an answer you have never read. This inventory becomes the brief.
Optimise for attributes, not just keywords. Map your content to the specific claims the AI makes, display quality, battery longevity, after-sales reach, software support windows, and so on. Each attribute deserves clear, factual, well-structured coverage on your own site and, just as importantly, in the third-party sources the model trusts.
Build the long tail deliberately. Because 84 percent of visibility comes from outside the top claims, depth wins. Cover the unglamorous attributes your competitors ignore. Specification pages, comparison content, FAQ blocks, and genuinely useful detail are what feed the tail.
Earn corroboration off your own domain. Generative engines weight consensus. Reviews, reputable editorial, retailer descriptions, and community discussion all shape what the model believes about you. A claim only you make is weaker than a claim the wider web repeats. Brand-owned content sets the language, third-party coverage ratifies it.
Defend sentiment on the fragile attributes. Resale, warranty, repair cost, and durability are where tone turns negative across the whole category. Get ahead of those with transparent, specific, reassuring content. You will not erase every hedge, but you can move the framing.
Attack the absence map. Take the claims where rivals appear and you do not, and treat each one as a content and PR target with an owner and a deadline. These are the highest-return moves because the ground is unguarded.
Make share of voice in AI answers a standing KPI. Track it monthly against named competitors, the way you track rankings or share of search. It is the metric that tells you whether any of the above is working, and it is the number that will matter most as more of search shifts into generated answers.
Search is becoming a conversation the buyer has with a model, and the brands that win it will be the ones who understood, early, that you no longer optimise to be found. You optimise to be the answer.
Work with Search Agency
We run this study for brands that want to know exactly how they show up inside AI answers, then we build the content and coverage plan to move that share of voice. If you want your own claim map for the category you compete in, get in touch and we will show you where you stand today.
---
This analysis is drawn from our own category research on how generative search engines describe brands in the Indonesian smartphone market, captured from Google AI Mode in early 2026. If you want to know your own share of voice inside AI answers, that is exactly the study we run.
See where your brand stands in AI answers today, benchmarked against your competitors, no pitch required.

Most of what AI cites about your brand lives on sites you do not control
The first Total Graph Authority post named third-party validation as the layer AI cites most. This is the deep dive, six trust tiers, engine by engine, in the order to build them.
read_post →
The five graphs an AI assistant reads before it decides to cite you
Backlinks are one connection an AI model follows. Here are the other four graphs that decide whether you get named in the answer.
read_post →
What AI knows about your brand is decided first on your own domain
Third-party mentions and social clips only corroborate a story your own site has to tell first. Here is how to build the first-party layer AI reads before it trusts anyone else.
read_post →